An analysis into which Premier League teams are overperforming their expected goals (xG) suggests that Tottenham may be due a correction.
This early-season review uses data from Opta to reveal which clubs are scoring more or fewer goals than their performances suggest.
After just seven games, the sample size remains small, but the trends already point to which sides might regress or rise as the season unfolds.
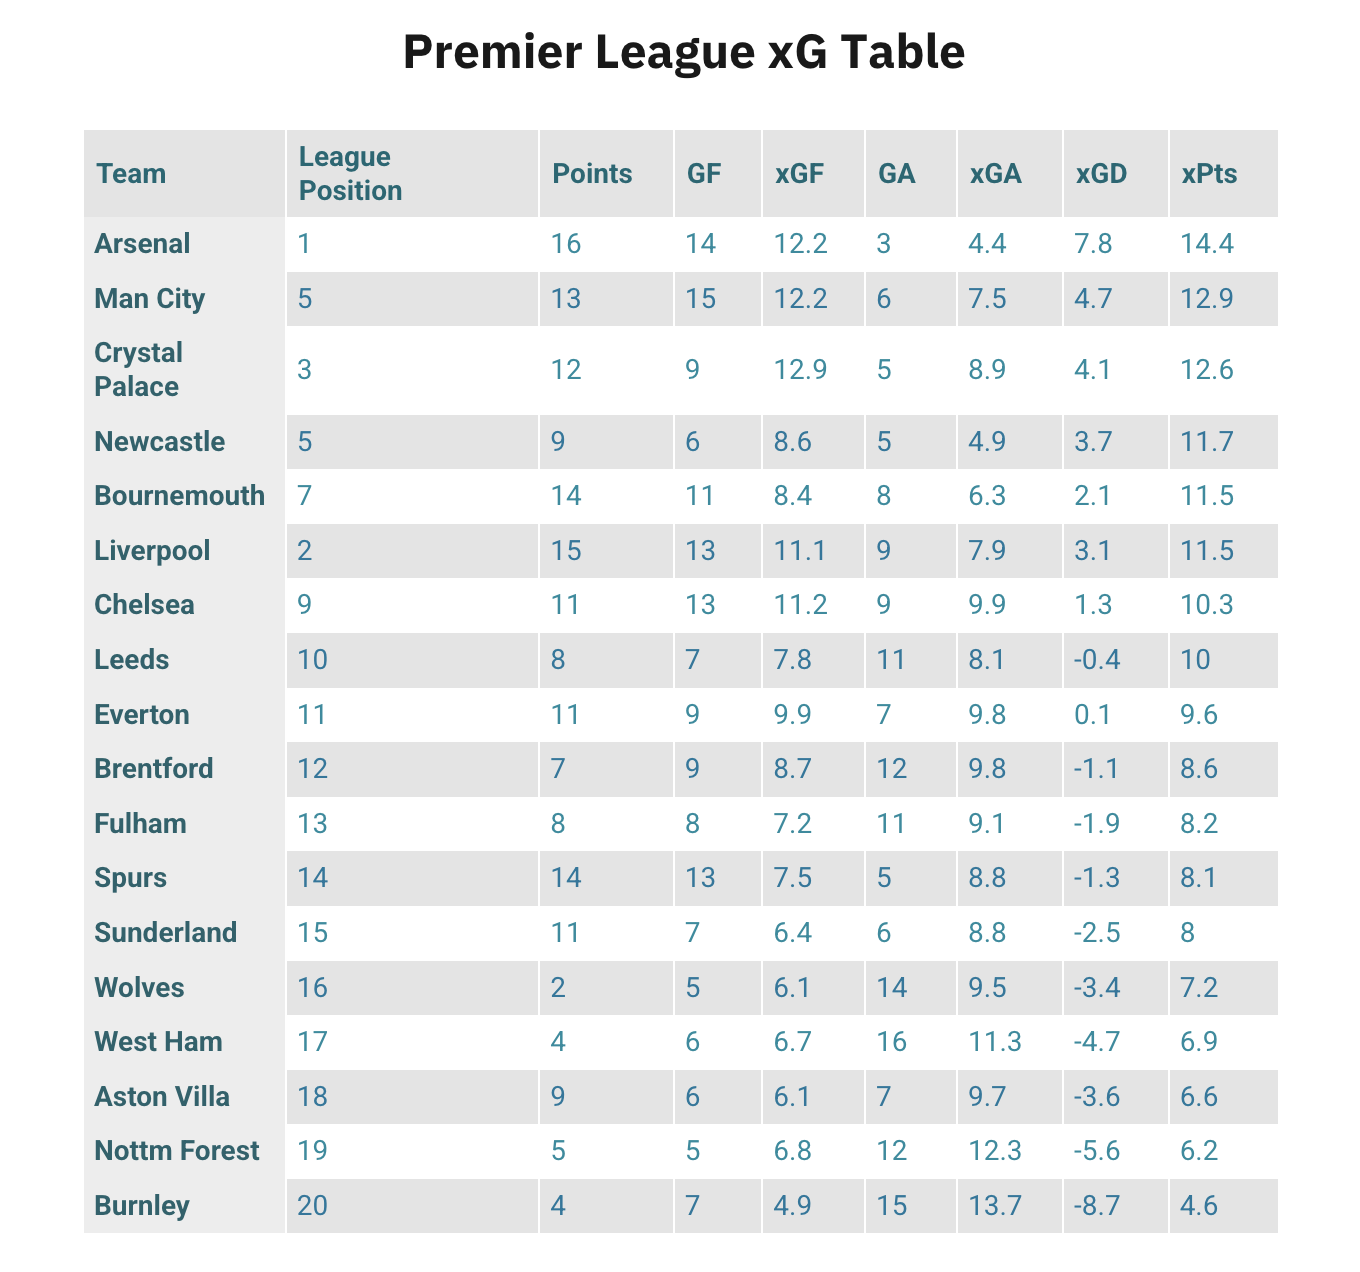
Premier League xG Table — How the Underlying Numbers Look
Based on the Opta xG metrics after seven games, Arsenal, Manchester City, and Crystal Palace lead the way in underlying performance.
Arsenal’s 12.2 xG and 4.4 xGA confirm they’re controlling both ends of the pitch, while City and Palace show similarly balanced profiles.
That alignment between strong xG metrics and positive results is the hallmark of sustainable form and the sort of consistency that separates genuine title contenders from early-season streaks.
(All xG figures in this article come from the Opta dataset provided for accuracy and editorial consistency.)
Which Teams Are Overperforming xG in the Premier League?
The biggest overperformers after seven games are:
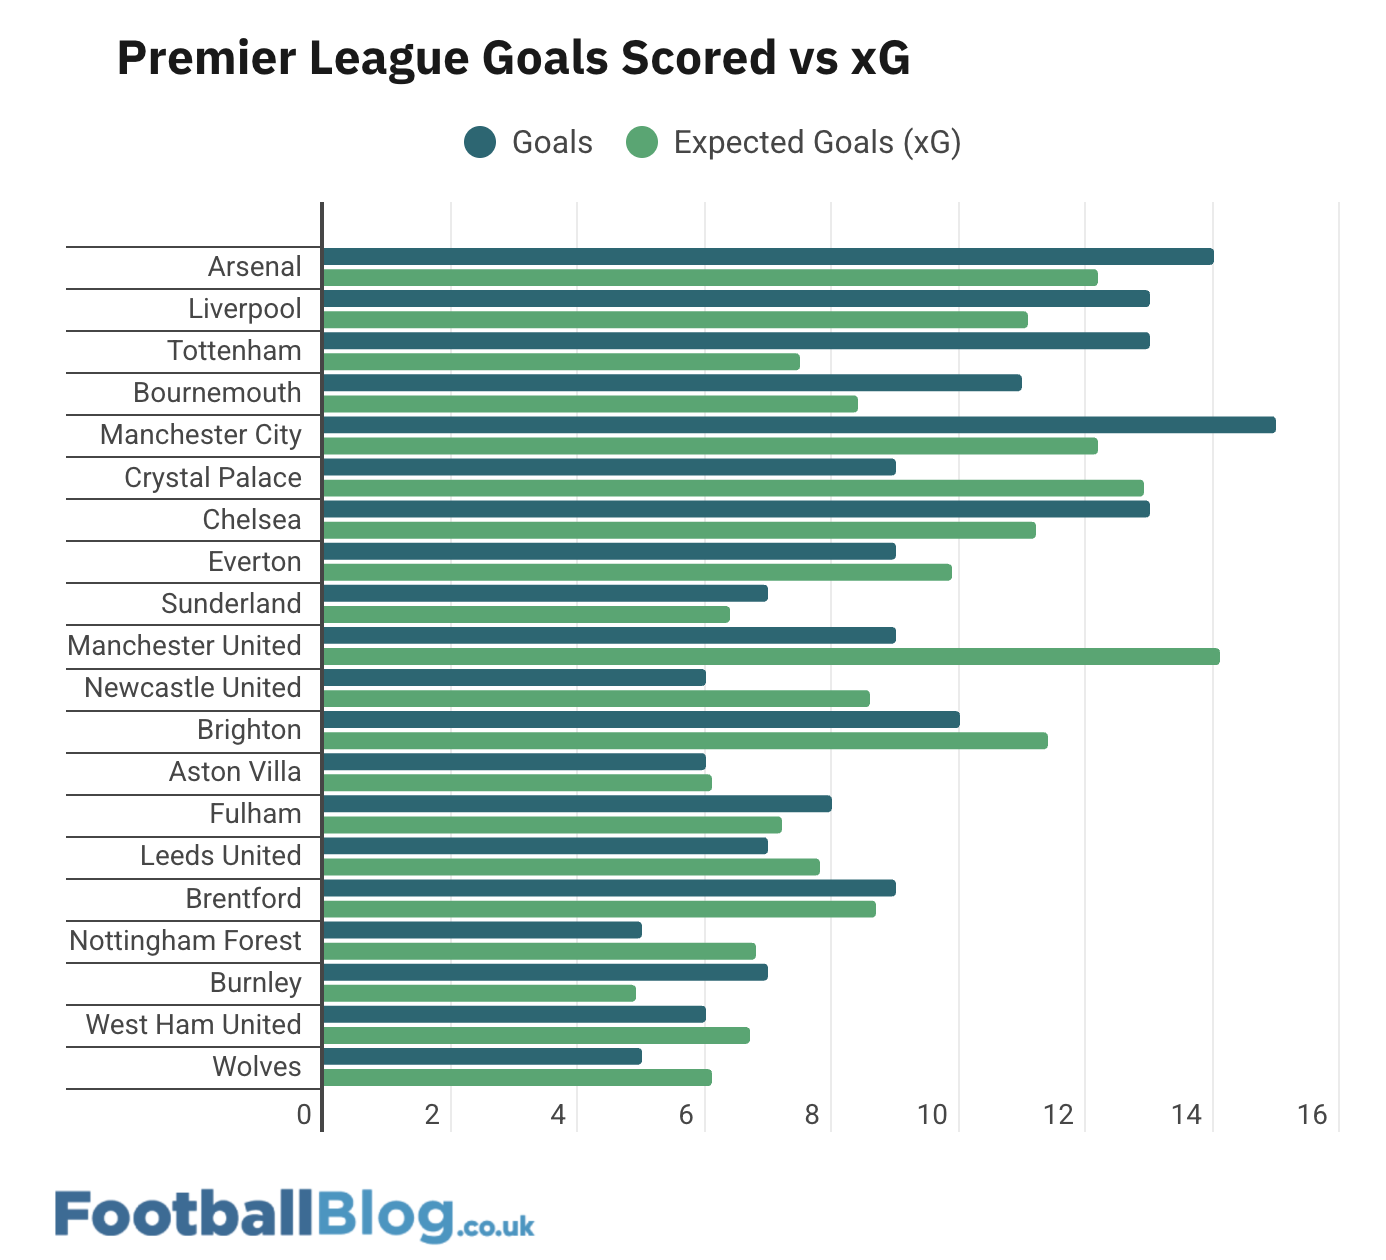
- Tottenham — +5.5 (13 goals vs 7.5 xG)
- Manchester City — +2.8 (15 vs 12.2)
- Bournemouth — +2.6 (11 vs 8.4)
- Burnley — +2.1 (7 vs 4.9)
- Liverpool — +1.9 (13 vs 11.1)
Tottenham’s figure is particularly striking. With 13 goals from just 7.5 expected, Spurs have the biggest positive differential in the league. Their finishing rate is elite – nearly 17% of shots have found the net – but those numbers are rarely maintainable across a full season.
Under manager Thomas Frank, Spurs have been fast, direct, and clinical. But their numbers don’t point to a title-contending side, despite sitting third in the Premier League table. Unless chance creation improves, regression toward their expected numbers is likely.
Manchester City’s overperformance is less concerning: their xG volume is high, and they routinely finish above average thanks to elite talent, namely Erling Haaland.
Bournemouth are another intriguing case. Their xG suggests they should have around eight goals, yet they’ve netted 11. Their forwards have been remarkably efficient, and their improved shot quality underlines the tactical strides they’ve made this season under Andoni Iraola.
Arsenal’s overperformance, by contrast, is modest. With 14 goals from 12.2 expected, they appear to be a well-tuned side translating control into results rather than benefiting from luck.
Who Is Underperforming xG in the Premier League?
At the other end of the spectrum, several teams’ results don’t reflect the quality of their chances:
- Manchester United — −5.1 (9 goals vs 14.1 xG)
- Crystal Palace — −3.9 (9 vs 12.9)
- Newcastle — −2.6 (6 vs 8.6)
- Brighton — −1.4 (10 vs 11.4)
- Wolves — −1.1 (5 vs 6.1)
Manchester United are once again an analytical paradox. They’re averaging more than 15 shots per game – more than Liverpool and Arsenal – but converting just 8.2% of them.
On paper, that screams inefficiency. But context matters: United’s often trailing behind early leaves them chasing games, producing inflated attacking numbers that don’t always reflect controlled performance.
Ruben Amorim’s side also seem to be forcing lower-quality efforts from range, with players like Bruno Fernandes and Matheus Cunha in particular being shot-happy.
Palace, meanwhile, look unlucky rather than flawed. Their xG profile (12.9 for, 8.9 against) ranks top three in the league, hinting that goals — and wins — should follow if their finishing normalises.
It should be noted that Palace are in European competition, and Oliver Glasner doesn’t exactly have a particularly large squad at his disposal, so there could be a bit of fatigue and hangover with their busier schedule affecting their league performances.
Elsewhere, Newcastle’s 6 goals from 8.6 expected tell a subtler story. Their approach play remains sharp, but finishing has deserted them in key moments. They’re due a correction upwards if they keep creating at the same rate.
What Do the xG Numbers Tell Us About Liverpool?
Liverpool’s start is a case study in controlled overperformance. With 13 goals from 11.1 expected, they’re not defying logic but rather demonstrating efficiency.
Their attack remains among the strongest in the league, with the likes of Mohamed Salah, Hugo Ektike and Alexander Isak all providing elite quality.
Yet the expected goals against (xGA) figure of 7.9 suggests an underlying issue defensively. Liverpool are allowing far more quality chances than Arsenal.
Arne Slot’s side often fall into end-to-end stretches in games, which can inflate both their attacking and defensive metrics. If they are to sustain a title charge, Liverpool will need to rediscover the compact, high-control structure that made them champions last season.
Premier League xG Trends — What the Data Tells Us
Ultimately, xG quantifies the probability of a shot becoming a goal based on its characteristics – location, angle, body part, etc. Over time, teams’ goals and xG tend to align, but small samples exaggerate variance.
Analysing Premier League xG trends helps flag who’s getting results above or below the quality of their performances but should be used as a guide rather than gospel. Seven matches provide enough data to suggest patterns, but it’s still too small a sample size to make objective judgements.
Finishing streaks can last weeks, even months, but history suggests the numbers eventually balance. Only a small handful of individuals have consistently defied xG, including Heung-min Son, Harry Kane, and some guy called Lionel Messi.
Of course, it’s important to note that seven games rarely tell the full story and that game state matters. Teams that fall behind often can inflate xG through volume, as we might have seen with Man United.
For overperforming teams such as Tottenham and Bournemouth, the challenge is to maintain their shot quality and efficiency before regression sets in. For underperformers like Manchester United and Newcastle, patience may yet pay off if performances stay consistent.
The next few weeks will show whether the hot streaks are sustainable or merely temporary form spikes. By December, the xG table and the actual one tend to start converging – and that’s when the real picture of who’s good, lucky or underachieving becomes clear.

 Chelsea Make Formal Contact With Free-Agent Striker Ahead of Summer Move
- Enzo Fernandez ready to sign five-year Real Madrid deal in Chelsea twist
- Federico Chiesa warns he could leave Liverpool without Iraola assurances
- Liverpool Pay the Price as Real Madrid’s Ibrahima Konate Package Is Revealed
- Chelsea and Man City locked in battle for Zadok Yohanna as Newcastle fall behind
- Tottenham target Harry Wilson after standout season with 19 goal involvements
- Liverpool Star Opens Up on Depression After Diogo Jota Loss in Emotional Interview
- Roma set to receive more money from Riccardo Calafiori’s Arsenal transfer
- Zielinski appears to confirm Dumfries to Real Madrid and drops Lewandowski Serie A hint
- Juventus Shortlist Six Strikers to Replace Dusan Vlahovic