The 2025/26 Premier League season is 29% complete and the table is starting to take shape.
Arsenal lead the way after 11 games, while Wolves sit winless and rock bottom.
Success in the Premier League does not come cheap. Nor does failure, for that matter.
During the 2025 summer transfer window, Premier League clubs spent more than £3.2 BILLION on new signings.
But what is the return on investment looking like as we head into the season’s third international break? FootballBlog.co.uk has crunched the numbers to work out how much each point has cost every club so far this season.
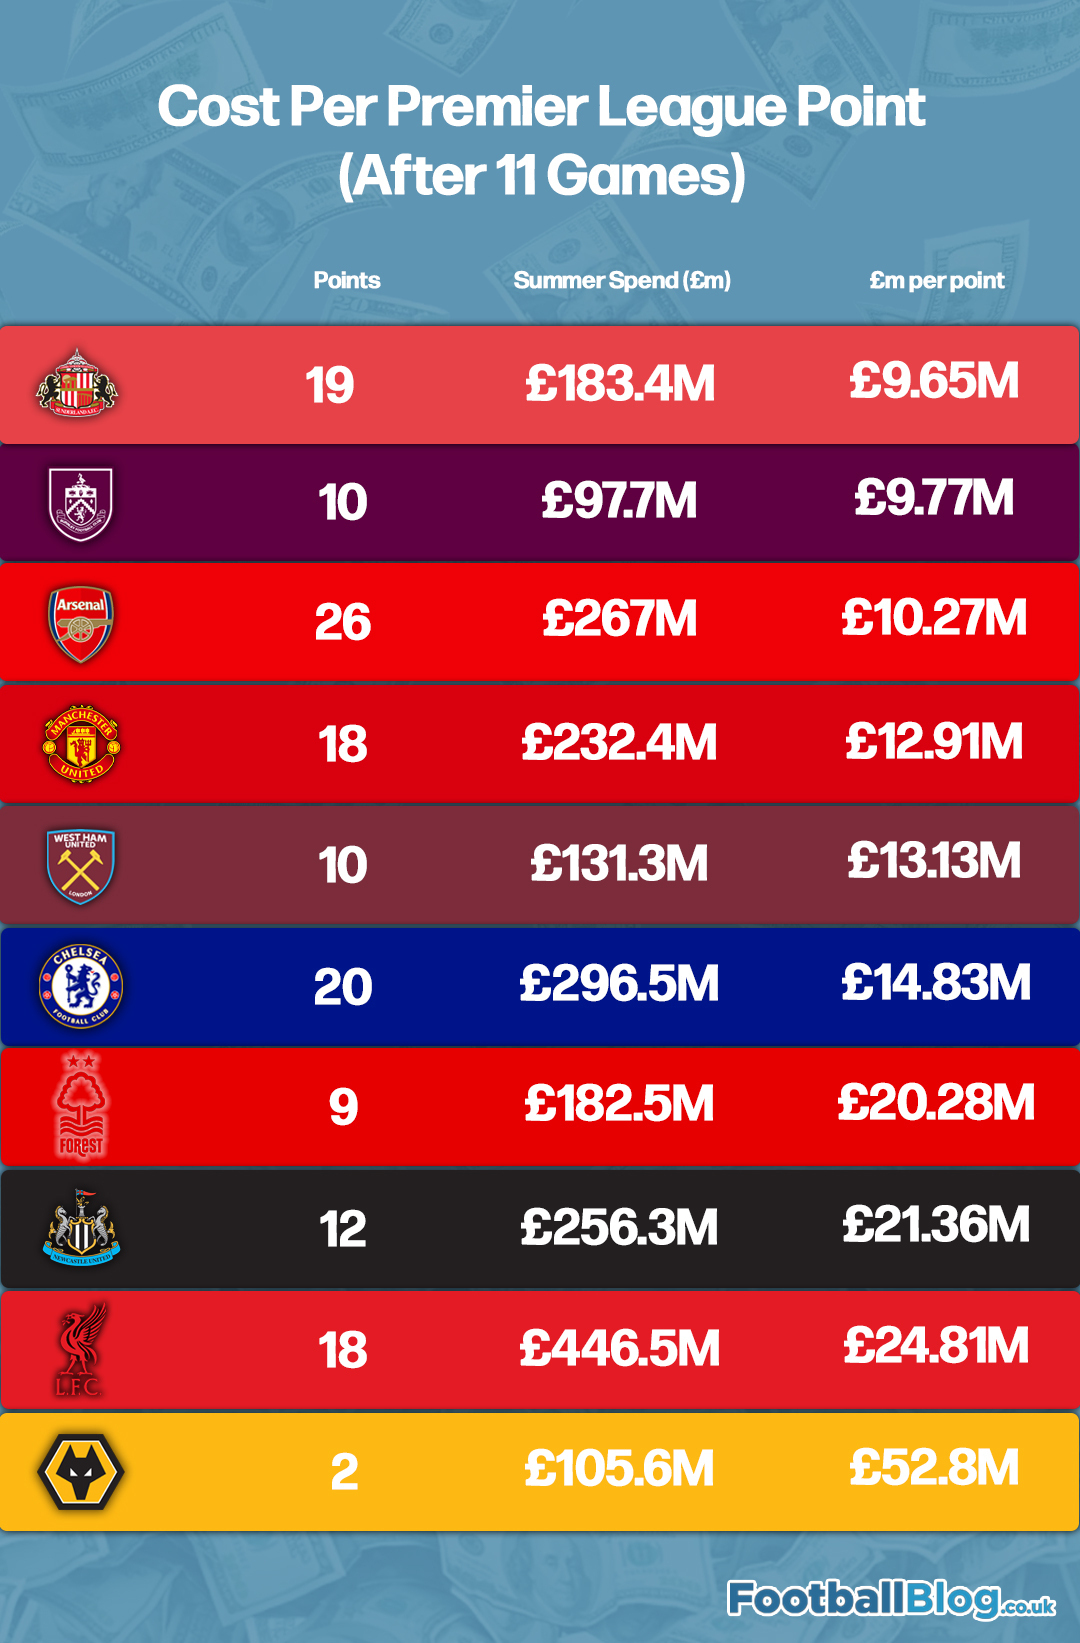
Liverpool were the biggest spenders during the summer, splashing out £446.5 million on the likes of Alexander Isak, Florian Wirtz, Hugo Ekitike and Jeremie Frimpong.
That figure, divided by the six wins and five losses Arne Slot’s side have earned so far this season, means that Liverpool’s first 18 points have cost a whopping £24.81 million.
If the Premier League table were reordered based on cost per point, Liverpool would find themselves in the relegation zone, alongside Newcastle and Wolves.
Newcastle spent £256.3m in the summer window and have just 12 points after 11 games, while Wolves have only two points after splashing out £105.6m on new signings.
Meanwhile, actual leaders Arsenal would be languishing in mid-table if the Premier League were ordered based on cost per point, where lower figures represent better value for money.
Premier League teams ranked by cost per point
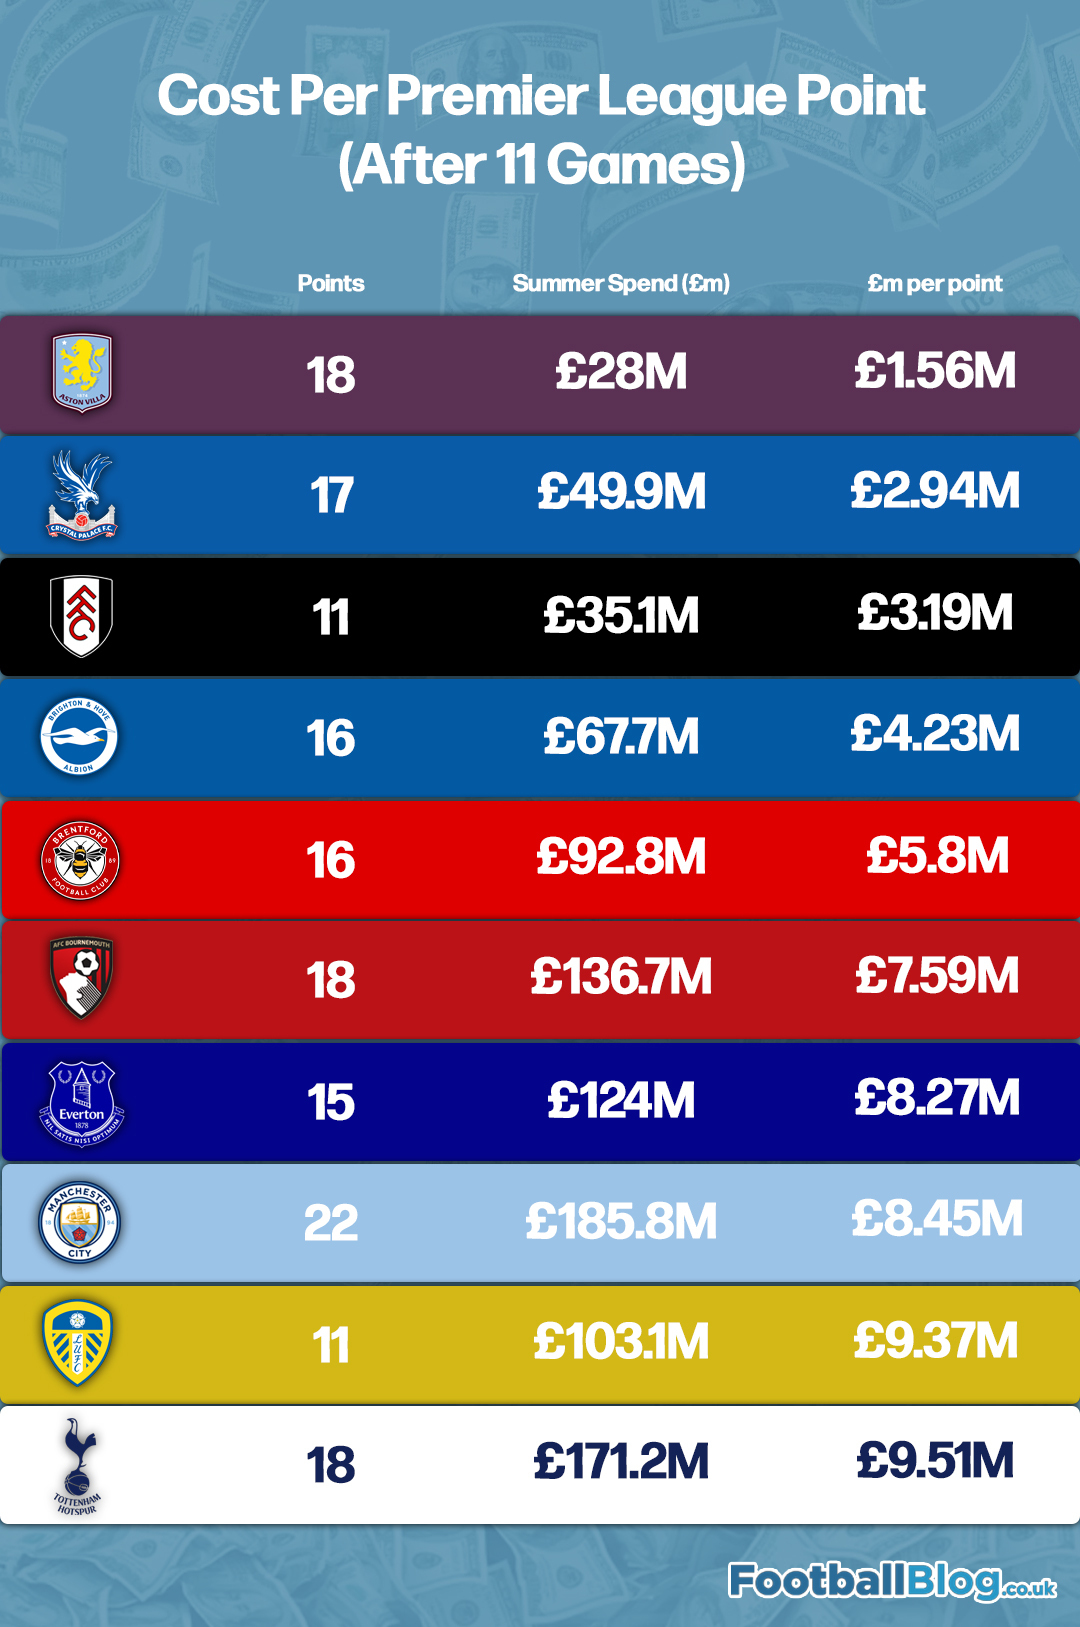
| Rank | Club | Points | Summer Spend (£m) | £m per point |
|---|---|---|---|---|
| 1 | Aston Villa | 18 | 28.0 | 1.56 |
| 2 | Crystal Palace | 17 | 49.9 | 2.94 |
| 3 | Fulham | 11 | 35.1 | 3.19 |
| 4 | Brighton | 16 | 67.7 | 4.23 |
| 5 | Brentford | 16 | 92.8 | 5.80 |
| 6 | Bournemouth | 18 | 136.7 | 7.59 |
| 7 | Everton | 15 | 124.0 | 8.27 |
| 8 | Man City | 22 | 185.8 | 8.45 |
| 9 | Leeds | 11 | 103.1 | 9.37 |
| 10 | Tottenham | 18 | 171.2 | 9.51 |
| 11 | Sunderland | 19 | 183.4 | 9.65 |
| 12 | Burnley | 10 | 97.7 | 9.77 |
| 13 | Arsenal | 26 | 267.0 | 10.27 |
| 14 | Man United | 18 | 232.4 | 12.91 |
| 15 | West Ham | 10 | 131.3 | 13.13 |
| 16 | Chelsea | 20 | 296.5 | 14.83 |
| 17 | Nott’m Forest | 9 | 182.5 | 20.28 |
| 18 | Newcastle | 12 | 256.3 | 21.36 |
| 19 | Liverpool | 18 | 446.5 | 24.81 |
| 20 | Wolves | 2 | 105.6 | 52.80 |
But what about net spend?
The clubs in the bottom three of the table above all have one thing in common: they made significant sales as well as signings during the summer transfer window, with each raking in more than £100m.
So we wanted to put together another alternative Premier League table — this one ranking teams based on cost per point in terms of net spend.
The net spend of Premier League clubs was calculated based on signings minus sales at the end of the summer transfer window in September.
However, some clubs actually made a profit rather than a loss — meaning their net spend was negative. In mathematical terms, that creates a quirk: the more points they earn, the closer their “£m per point” figure moves towards zero, which can wrongly make them look worse the better they perform.
To make the comparison clearer, we have used coloured arrows next to the figures below. Clubs marked with a green upward arrow are earning a profit per point, while those with a red downward arrow are recording a cost per point.
This system is still slightly flawed for teams that recorded a negative spend. For example, Wolves have a huge profit-per-point figure due to their tiny points tally — had they earned more points, their profit per point would naturally fall and look less dramatic.
However, clearer conclusions can be drawn from the bottom half of the table, where clubs with genuine transfer outlays can be compared more accurately.
Premier League teams ranked by profit/cost per point based on net transfer spend

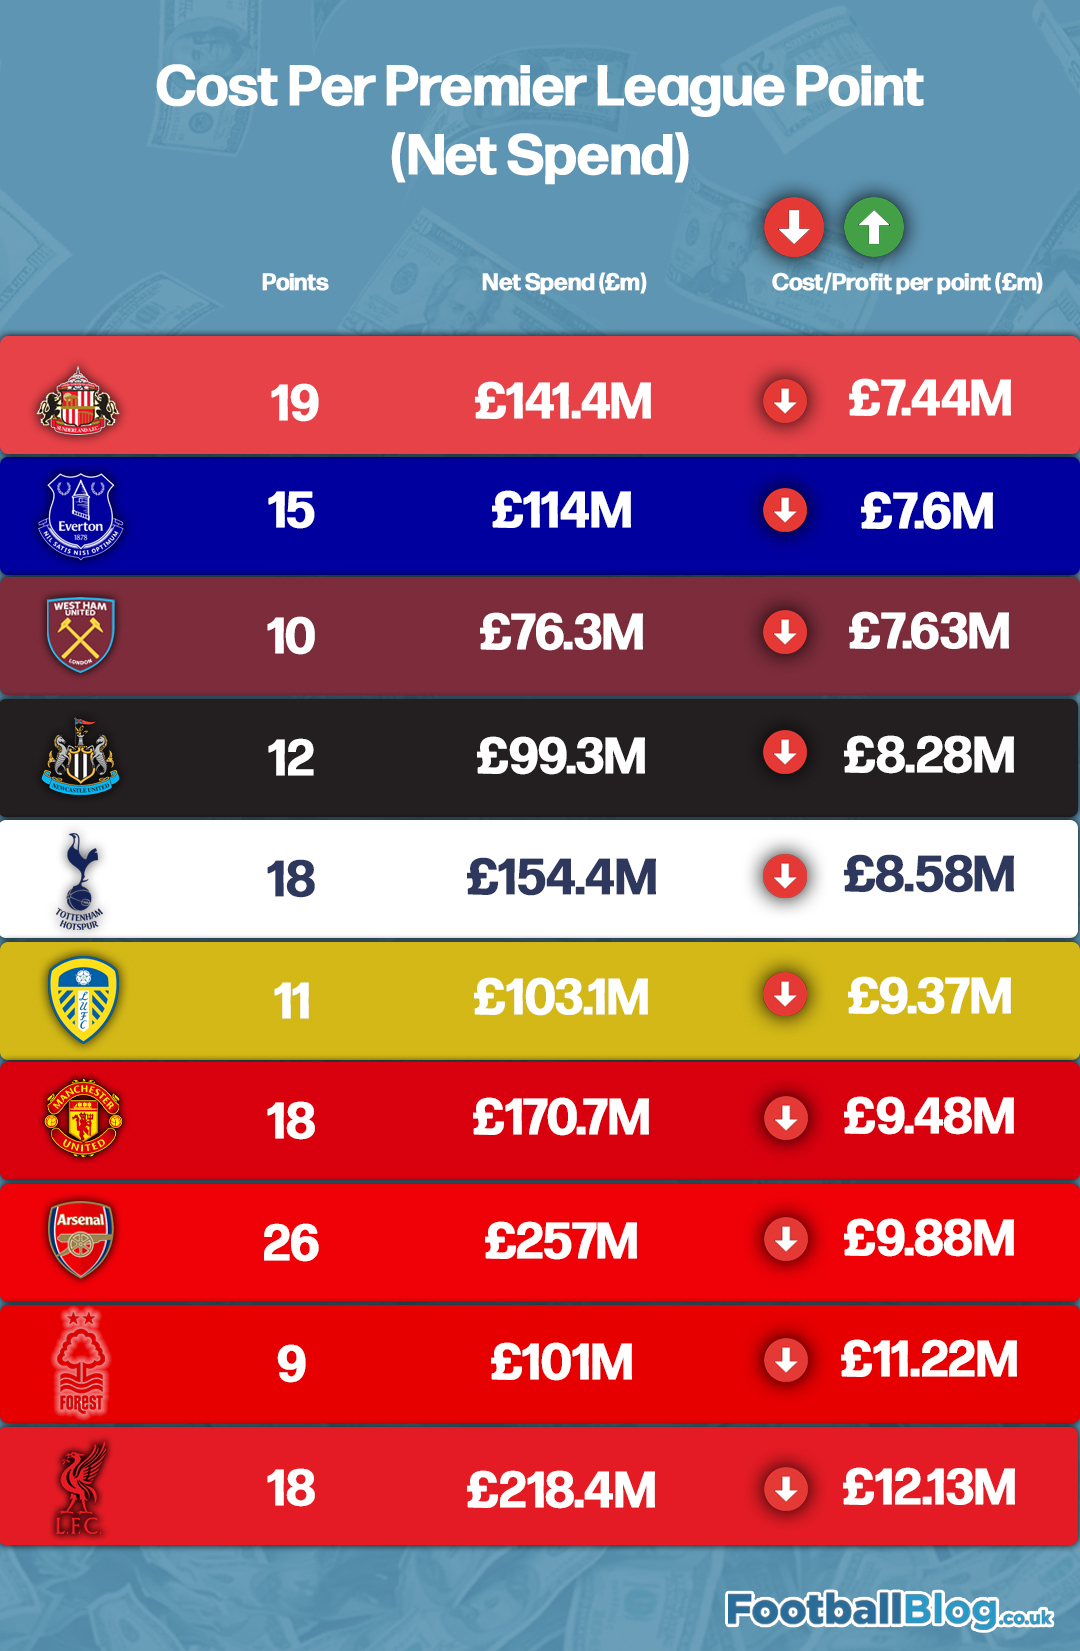
Liverpool, Arsenal and Man United currently look like the least cost-efficient performers relative to their spending, sitting in the bottom four alongside Nottingham Forest.
With reference to Forest, it is worth noting that these figures only relate to player transfers and therefore do not factor in how much compensation Premier League clubs have spent to sack their managers.
Of the seven clubs to have made a transfer profit this summer, four currently sit in the top half of the real Premier League table.
Chelsea are the highest of those four. The Blues are third, just six points below leaders Arsenal, while Aston Villa (6th), Bournemouth (9th) and Crystal Palace (10th) are all seemingly punching above their financial weight so far.
Should you wish to use any info or graphics from this article, please ensure you link back to FootballBlog.co.uk

 Saliba’s Back Injury: No Surgery, No Return Date as Arsenal Plan Around Absence
- Real Madrid Close to Personal Terms With Rodri as City Talks Loom
- Emery Reunion Drives Villa’s Move for £65m-Rated Jackson
- PSG’s £120m-Plus Barcola Demand Puts FSG’s Ambition to the Test
- Savinho to Spurs: Why the £60m Man City Deal Looks Done
- Inter Eye Cristian Romero But €50m Fee and Wages Create Major Hurdles
- Trafford the Only Keeper Target as Leeds Stall on Charles and Chase Brandt
- Argentina Face FIFA Investigation After World Cup Final Confrontations
- Guimarães Bid Incoming and Williams Opens Door in Arsenal’s £167m Push
- Ferran Torres Transfer: Liverpool and PSG Compete for Barcelona Forward